Anexo:Países por producción de aguacate
Esta es una lista de países por producción de aguacate, llamado también palta, en 2022, basada en los datos de la Organización de las Naciones Unidas para la Alimentación y la Agricultura.[1] La producción mundial total de aguacate en 2022 era de 8,978,275 toneladas. México era con creces el mayor productor, representando el 28.12% de la producción mundial. Los territorios dependientes son mostrados en cursiva.
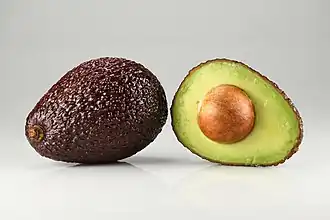
Producción mundial de aguacate
Países productores de aguacate (palta)
| N° | Países productores de AGUACATE (PALTA) |
Continente | Producción de 2022 en Toneladas [2] |
% a Nivel Mundial |
|---|---|---|---|---|
| TOTAL | MUNDO | — | 8 978 275 ton. | 100 % |
| 1° | América | 2 529 582 ton. | 28,17 % | |
| 2° | América | 1 090 664 ton. | 12,15 % | |
| 3° | América | 866 457 ton. | 9,65 % | |
| 4° | América | 737 201 ton. | 8,21 % | |
| 5° | África | 458 439 ton. | 5,11 % | |
| 6° | Asia | 389 000 ton. | 4,33 % | |
| 7° | América | 338 238 ton. | 3,77 % | |
| 8° | Asia | 210 595 ton. | 2,34 % | |
| 9° | Asia | 189 667 ton. | 2,11 % | |
| 10° | América | 173 507 ton. | 1,93 % | |
| 11° | América | 168 010 ton. | 1,87 % | |
| 12° | África | 167 884 ton. | 1,87 % | |
| 13° | América | 142 340 ton. | 1,58 % | |
| 14° | América | 138 964 ton. | 1,55 % | |
| 15° | Asia | 135 860 ton. | 1,51 % | |
| 16° | América | 128 611 ton. | 1,43 % | |
| 17° | Europa | 105 930 ton. | 1,18 % | |
| 18° | África | 103 602 ton. | 1,15 % | |
| 19° | África | 98 720 ton. | 1,10 % | |
| 20° | África | 94 096 ton. | 1,05 % | |
| 21° | Oceanía | 86 171 ton. | 0,96 % | |
| 22° | África | 74 325 ton. | 0,83 % | |
| 23° | África | 62 035 ton. | 0,69 % | |
| 24° | África | 55 119 ton. | 0,61 % | |
| 25° | América | 43 757 ton. | 0,49 % | |
| 26° | Oceanía | 42 346 ton. | 0,47 % | |
| 27° | Asia | 40 181 ton. | 0,45 % | |
| 28° | África | 36 648 ton. | 0,41 % | |
| 29° | África | 27 352 ton. | 0,30 % | |
| 30° | América | 26 440 ton. | 0,29 % | |
| 31° | Europa | 25 790 ton. | 0,28 % | |
| 32° | Asia | 20 076 ton. | 0,22 % | |
| 33° | Asia | 19 408 ton. | 0,21 % | |
| 34° | América | 15 329 ton. | 0,17 % | |
| 35° | Asia | 14 245 ton. | 0,15 % | |
| 36° | Europa | 13 890 ton. | 0,15 % | |
| 37° | América | 12 514 ton. | 0,14 % | |
| 38° | América | 12 378 ton. | 0,13 % | |
| 39° | América | 10 297 ton. | 0,11 % | |
| 40° | África | 9 506 ton. | 0,23 % | |
| 41° | África | 9 288 ton. | 0,22 % | |
| 42° | África | 8 148 ton. | 0,19 % | |
| 43° | África | 6 169 ton. | 0,19 % | |
| 44° | África | 5 838 ton. | 0,19 % | |
| 45° | Asia | 4 334 ton. | 0,18 % | |
| 46° | América | 4 150 ton. | 0,18 % | |
| 47° | América | 3 540 ton. | 0,16 % | |
| 48° | Asia | 3 151 ton. | 0,16 % | |
| 49° | América | 2 400 ton. | 0,16 % | |
| 50° | América | 2 199 ton. | 0,15 % | |
| 51° | América | 1 552 ton. | 0,14 % | |
| 52° | Oceanía | 1 408 ton. | 0,14 % | |
| 53° | América | 1 403 ton. | 0,13 % | |
| 54° | Europa | 1 370 ton. | 0,13 % | |
| 55° | América | 1 188 ton. | 0,12 % | |
| 56° | América | 1 081 ton. | 0,11 % | |
| 57° | Europa | 1 080 ton. | 0,11 % | |
| 58° | Europa | 1 037 ton. | 0,10 % | |
| 59° | África | 874 ton. | 0,10 % | |
| 60° | América | 755 ton. | 0,09 % | |
| 61° | Asia | 458 ton. | 0,08 % | |
| 62° | América | 340 ton. | 0,08 % | |
| 63° | África | 331 ton. | 0,08 % | |
| 64° | América | 311 ton. | 0,08 % | |
| 65° | Oceanía | 263 ton. | 0,07 % | |
| 66° | Asia | 136 ton. | 0,07 % | |
| 67° | Oceanía | 115 ton. | 0,06 % | |
| 68° | América | 99 ton. | 0,06 % | |
| 69° | América | 53 ton. | 0,06 % | |
| 70° | Oceanía | 21 ton. | 0,06 % | |
| 71° | África | 13 ton. | 0,05 % | |
| Fuente : Organización de las Naciones Unidas para la Alimentación y la Agricultura (FAO) [2] | ||||
Véase también
- Países productores de arroz a nivel mundial
- Países productores de avena a nivel mundial
- Países productores de café a nivel mundial
- Países productores de cacao a nivel mundial
- Países productores de frijol a nivel mundial
- Países productores de maíz a nivel mundial
- Países productores de trigo a nivel mundial
- Países productores de soya a nivel mundial
- Países por población de ganado vacuno a nivel mundial
Referencias
- ↑ «FAOSTAT». www.fao.org. Consultado el 9 de enero de 2024.
- ↑ a b Organización de las Naciones Unidas para la Alimentación y la Agricultura (2024). «Países Productores de Trigo a Nivel Mundial». ourworldindata.org. Consultado el 13 de agosto de 2024.
| Control de autoridades |
|
|---|
 Datos: Q56280759