Anexo:Regiones de Perú por PIB
Esta es una lista de los departamentos del Perú por PIB. Se muestra una comparación en cada departamento con el PIB equivalente de algún país de acuerdo a los datos del Fondo Monetario Internacional comparando al mismo año.
Departamentos por PIB
Departamentos por PIB de acuerdo a la información del MINCETUR[1] e INEI 2022.
| N.º | VVVVDepartamentoVVVV | PIB | Crecimiento
(2021-2022) |
% Nacional | País Comparable 2022 PIB | |||
|---|---|---|---|---|---|---|---|---|
| VNominalV
(PEN) |
VNominalV | VVPPAVV | VNominalV(USD)[3] | VPPAV(INT$)[4] | ||||
| 1 | S/ 431 898 M | $ 112 941 M | $ 237 306 M | 45.3 % | ||||
| — |
S/ 380 506 M | $ 99 502 M | $ 209 069 M | 39.5 % | ||||
| — |
S/ 51 392 M | $ 13 439 M | $ 28 237 M | 5.3 % | ||||
| 2 | S/ 59 812 M | $ 16 641 M | $ 32 864 M | 6.2 % | ||||
| 3 | S/ 45 836 M | $ 11 986 M | $ 25 184 M | 4.8 % | ||||
| 4 | S/ 43 266 M | $ 11 314 M | $ 23 773 M | 4.6 % | ||||
| 5 | S/ 39 985 M | $ 10 456 M | $ 21 970 M | 4.3 % | ||||
| 6 | S/ 39 029 M | $ 10 206 M | $ 21 445 M | 4.1 % | ||||
| 7 | S/ 37 059 M | $ 12 560 M | $ 20 362 M | 3.9 % | ||||
| 8 | S/ 31 820 M | $ 8 321 M | $ 17 484 M | 3.3 % | ||||
| 9 | S/ 29 151 M | $ 7 623 M | $ 16 017 M | 3.0 % | ||||
| 10 | S/ 24 719 M | $ 6 464 M | $ 13 582 M | 2.6 % | ||||
| 11 | S/ 23 736 M | $ 6 207 M | $ 13 042 M | 2.5 % | ||||
| 12 | S/ 21 136 M | $ 5 527 M | $ 11 613 M | 2.2 % | ||||
| 13 | S/ 16 822 M | $ 4 399 M | $ 9 243 M | 1.8 % | ||||
| 14 | S/ 15 147 M | $ 3 961 M | $ 8 323 M | 1.6 % | ||||
| 15 | S/ 13 239 M | $ 3 462 M | $ 7 274 M | 1.4 % | ||||
| 16 | S/ 13 010 M | $ 3 402 M | $ 7 148 M | 1.4 % | ||||
| 17 | S/ 12 532 M | $ 3 277 M | $ 6 886 M | 1.3 % | ||||
| 18 | S/ 11 866 M | $ 3 103 M | $ 6 520 M | 1.2 % | ||||
| 19 | S/ 11 262 M | $ 2 945 M | $ 6 188 M | 1.2 % | ||||
| 20 | S/ 10 023 M | $ 2 621 M | $ 5 507 M | 0.9 % | ||||
| 21 | S/ 8 795 M | $ 2 300 M | $ 4 832 M | 0.9 % | ||||
| 22 | S/ 7 396 M | $ 1 934 M | $ 4 064 M | 0.8 % | ||||
| 23 | S/ 6 054 M | $ 1 583 M | $ 3 326 M | 0.6 % | ||||
| 24 | S/ 5 434 M | $ 1 421 M | $ 2 986 M | 0.6 % | ||||
| 25 | S/ 3 350 M | $ 876 M | $ 1 841 M | 0.4 % | ||||
| S/ 962 377 M | $ 251 661 M | $ 528 776 M | 100.0 % | |||||
| ||||||||
| PIB Nominal por Departamentos 2022 en dólares estadounidenses |
|---|
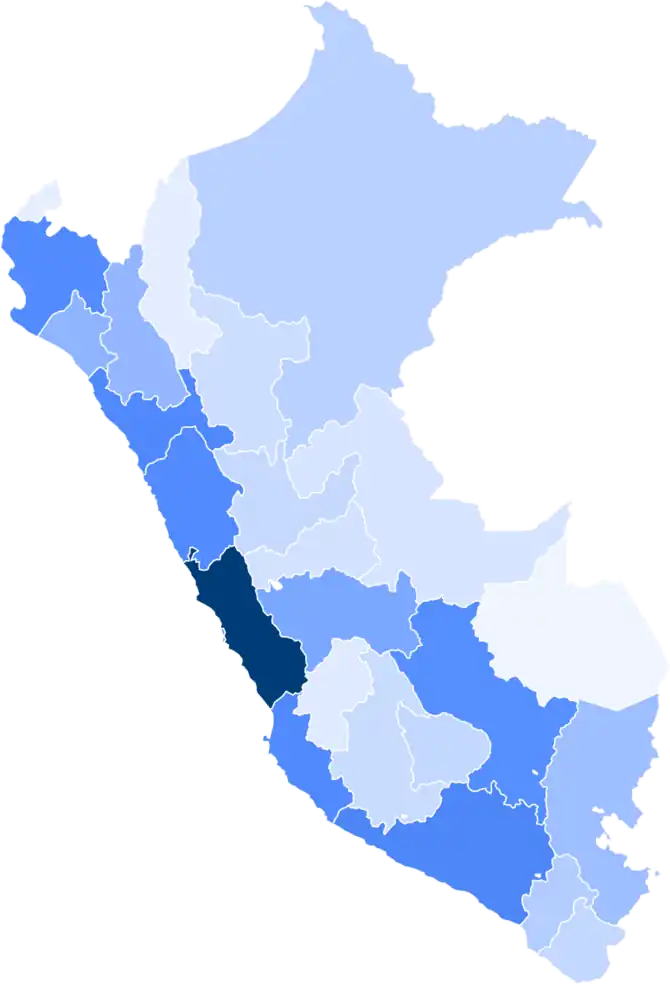
|
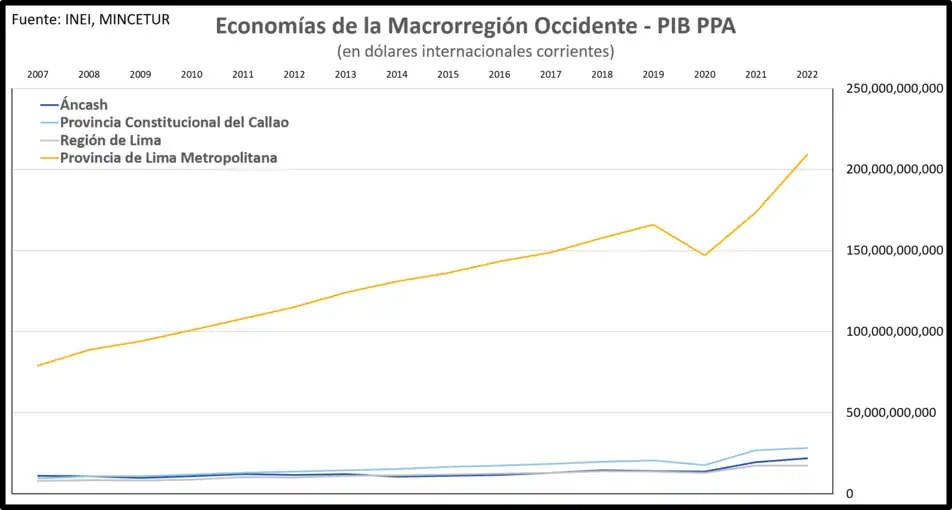
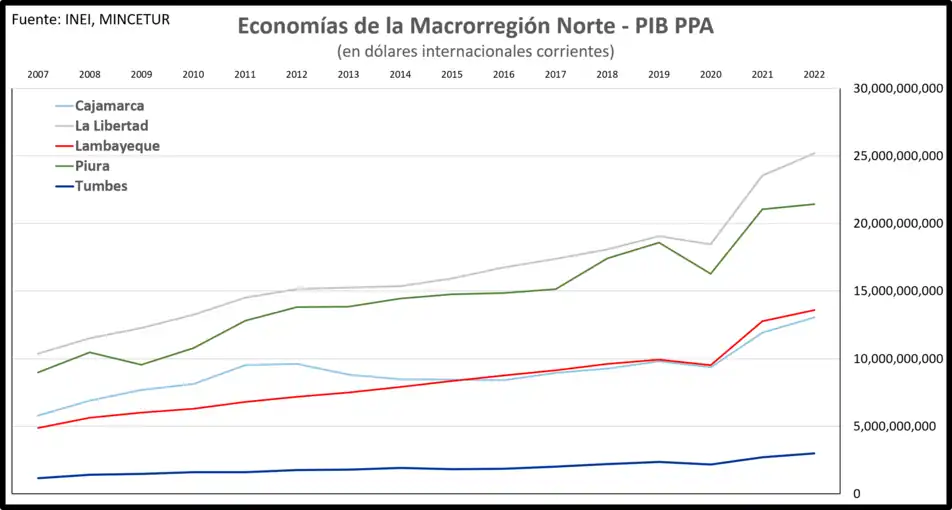
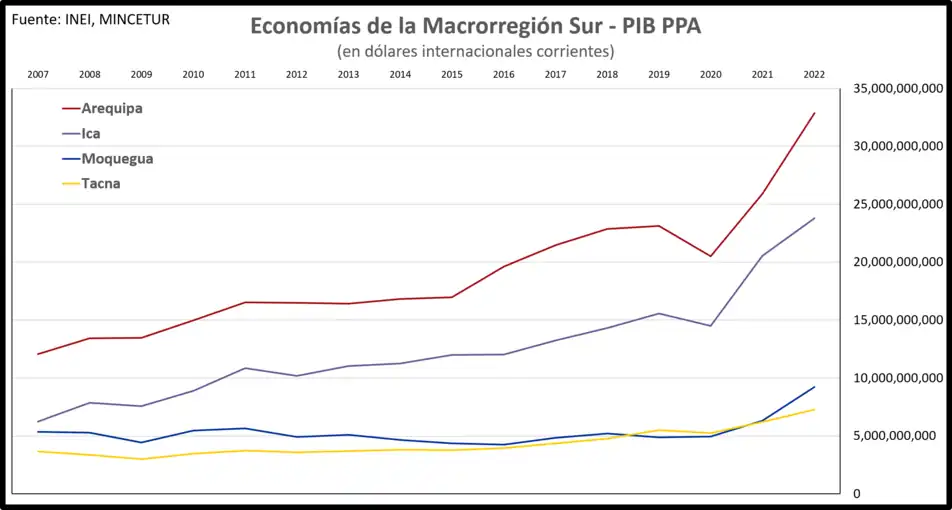
Macrorregiones del Perú por PIB
| N.º | VMacrorregiónV | VDepartamentosV | PIB | % Nacional | País Comparable 2022 PIB | |||
|---|---|---|---|---|---|---|---|---|
| VNominalV
(PEN) |
VNominalV
(USD) |
VVPPAVV
(INT$) |
VNominalV(USD)[3] | VPPAV(INT$)[4] | ||||
| 1 | Occidente | S/ 503 703 M | $ 131 718 M | $ 276 760 M | 52.3 % | |||
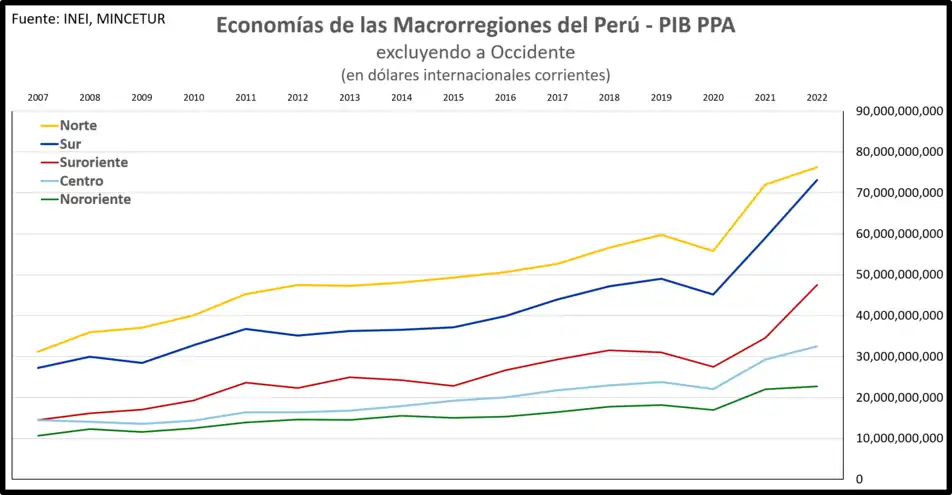
| 2 | Norte | S/ 138 754 M | $ 36 284 M | $ 76 238 M | 14.4 % | |||
| 3 | Sur | S/ 133 140 M | $ 34 816 M | $ 73 154 M | 13.8 % | |||
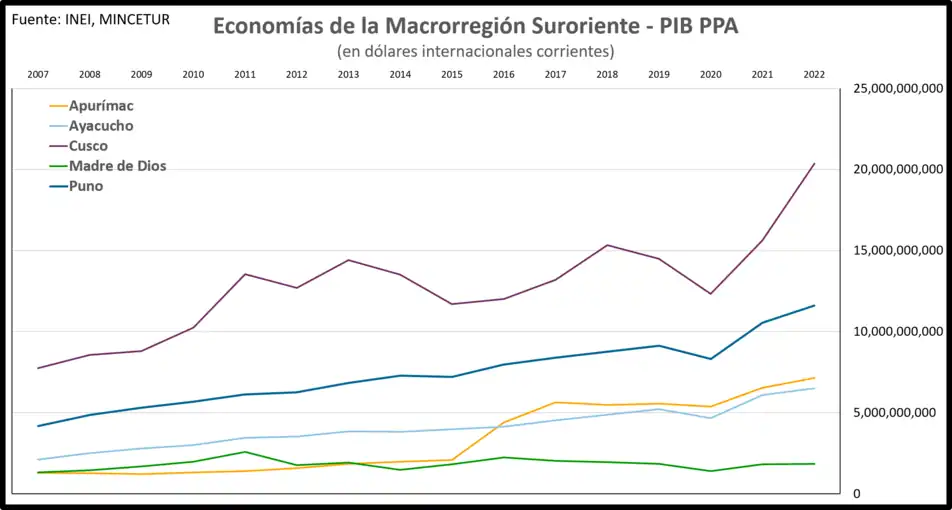
| 4 | Suroriente | S/ 86 421 M | $ 22 599 M | $ 47 484 M | 9.0 % | |||
| 5 | Centro | S/ 59 102 M | $ 15 455 M | $ 32 473 M | 6.2 % | |||
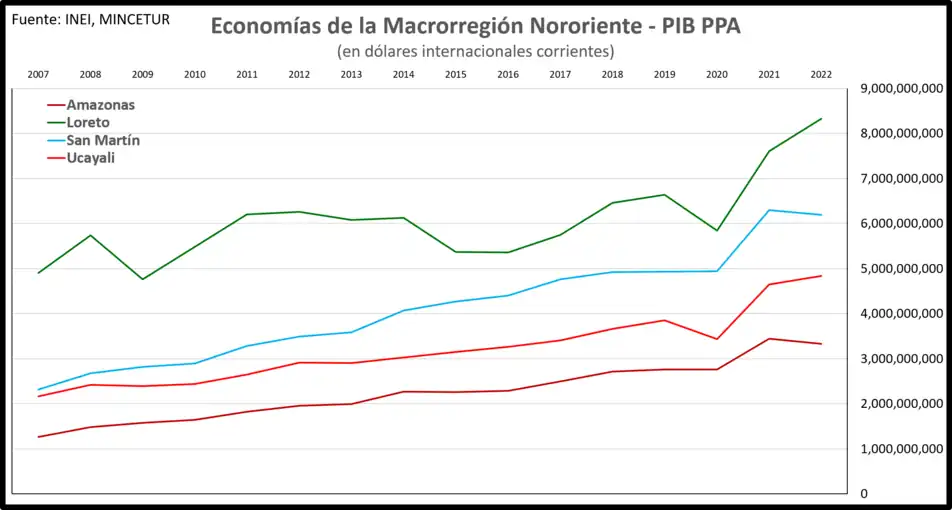
| 6 | Nororiente | S/ 41 258 M | $ 10 789 M | $ 22 669 M | 4.3 % | |||
| S/ 962 377 M | $ 255 530 M | $ 528 776 M | 100.0 % | |||||
Cronología: 2007 - 2022

.
Véase también
Referencias
- «Reporte de Comercio Regional (RCR)». www.gob.pe. Consultado el 9 de febrero de 2023.
- «USD/PEN - Dólar estadounidense/Sol peruano». Consultado el 22 de marzo de 2023.
- «https://www.imf.org/external/datamapper/NGDPD@WEO/OEMDC/ADVEC/WEOWORLD». www.imf.org. Consultado el 15 de agosto de 2023.
- «https://www.imf.org/external/datamapper/PPPGDP@WEO/OEMDC/ADVEC/WEOWORLD». www.imf.org. Consultado el 15 de agosto de 2023.
- Instituto Nacional de Estadística e Informática (2022). «Producto Interno Bruto por Departamentos 2007-2021». Consultado el 6 de noviembre de 2023.
Este artículo ha sido escrito por Wikipedia. El texto está disponible bajo la licencia Creative Commons - Atribución - CompartirIgual. Pueden aplicarse cláusulas adicionales a los archivos multimedia.